How do you turn thousands of rows of international data into concrete decisions? That is the question I answered for the NGO DWFA, which wanted to know where and how to act first to improve access to drinking water.
“Global story”: population, demographic growth and drinking-water access
The challenge: prioritising with heterogeneous data
Population, urbanisation, water access, mortality linked to unsafe water, political stability: each indicator tells part of the story. The challenge was to connect them to surface priorities that non-data decision-makers can read at a glance.
A funnel approach: from the world down to the country
I built three levels of reading, each with its own dashboard.
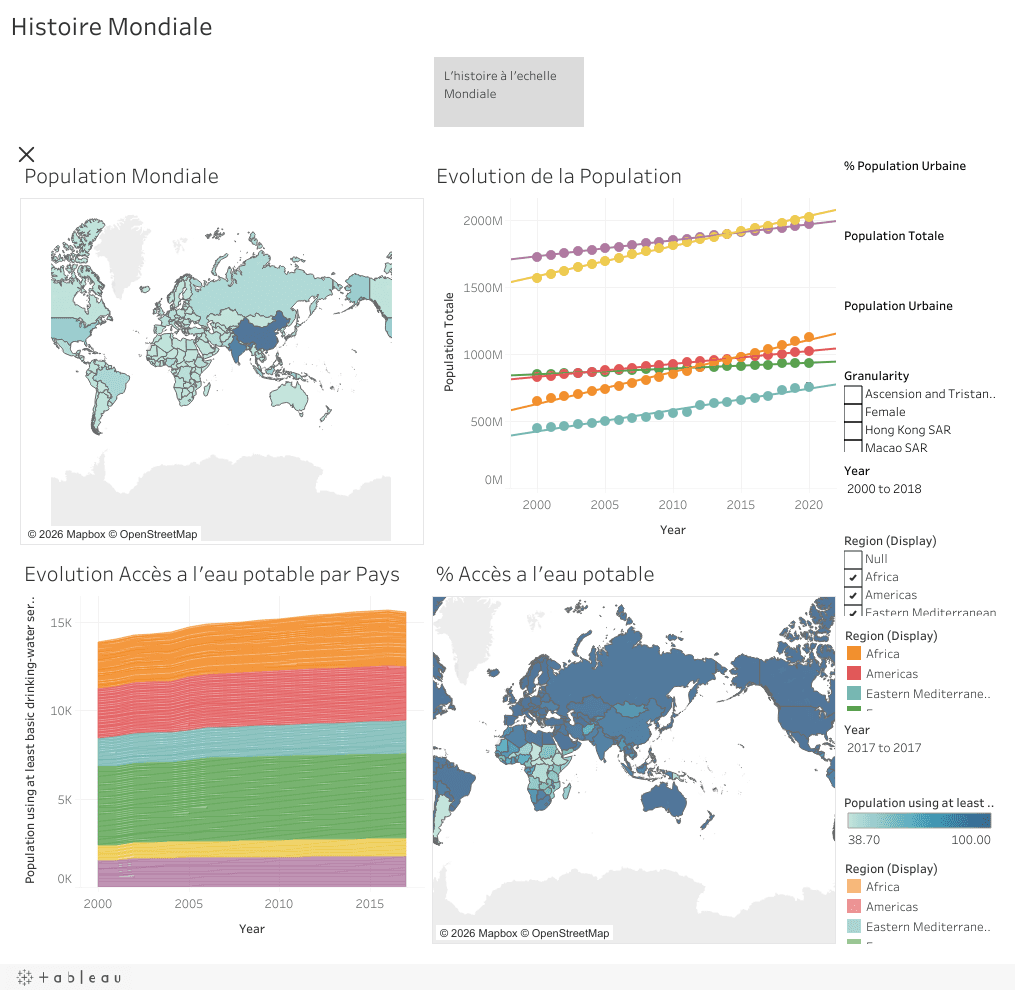
1. The global view. Maps and time series show demographic dynamics and drinking-water coverage by major region from 2000 to 2018.
 Global dashboard
2. The continental zoom. Comparing mortality attributed to unsafe water with political stability highlights the areas where intervention is both most needed and most delicate.
 Continental dashboard: mortality and political stability in Africa
3. The country level. Segmenting countries into three groups leads to three lines of action: create water services, modernise existing services, or advise local stakeholders.
 “Country story”: service creation, modernisation and advisory
What the visualisations reveal
The scatter plots show a clear relationship: the lower the basic water access, the higher the mortality linked to unsafe water, and this mortality also tends to be higher in politically unstable countries. Crossing these views separates the countries where an NGO can act quickly from those needing more gradual support.
 “Consulting” view: water access, mortality and political stability
Skills applied
- Data preparation and reliability: consolidating indicators from multiple sources, consistency checks, choosing the right granularity (rural, urban, total).
- Analysis: trends, correlations, cluster segmentation.
- Visualisation: maps, time series, combined charts, interactive filters.
- Data storytelling: three stories that guide the reader to the recommendation.
- Decision focus: translating analysis into concrete lines of action for the client.
And for Supply Chain?
This is exactly the approach I apply to operations: start from a business question, make the data reliable, build dashboards for each decision level (floor, site, management) and tell the story behind the numbers to drive action. Whether it is drinking water, warehouse productivity or service level, the method stays the same.