Supply Chain & Operations
- Operational diagnostics
- Flow optimisation
- Warehouse management
- Performance management
- Continuous improvement
- Operations management
Supply Chain · Data · Technology
I help companies improve their operational performance, drive their digital transformation and make intelligent use of their data.
France · Luxembourg · Belgium · Switzerland · Germany · United Kingdom · Europe · Africa · International
 OUATTARA ZanaSupply Chain Manager · Operations · Data
Introduction
A Supply Chain and operations management professional with more than 12 years of experience in demanding logistics and operational environments. My background combines hands-on operations, performance management and continuous upskilling in data, ERP systems and automation.
Environments I have worked in
 La PostePostal & parcel services
 Fnac-DartySpecialist retail
 RGISInventory services
 AmazonE-commerce & logistics
 Légion étrangère / Armée de TerreDefence
 CEVA LogisticsContract logistics
Data & performance
An example of the kind of dashboard I design to run a warehouse: customer service, productivity and inventory accuracy, refreshed automatically.
97.1% (W12)
S112 weeksS12
142lines / h
MonTueWedThuFriSat
98.4%
Share of locations with no gap between book and physical stock (cycle counting).
Expertise
Methodology
Every engagement follows a clear framework, from diagnosis to continuous improvement.
01 / 05
Understand needs and processes
Team interviews, on-site observation, flow mapping and collection of existing data.
Portfolio
 Data Analytics
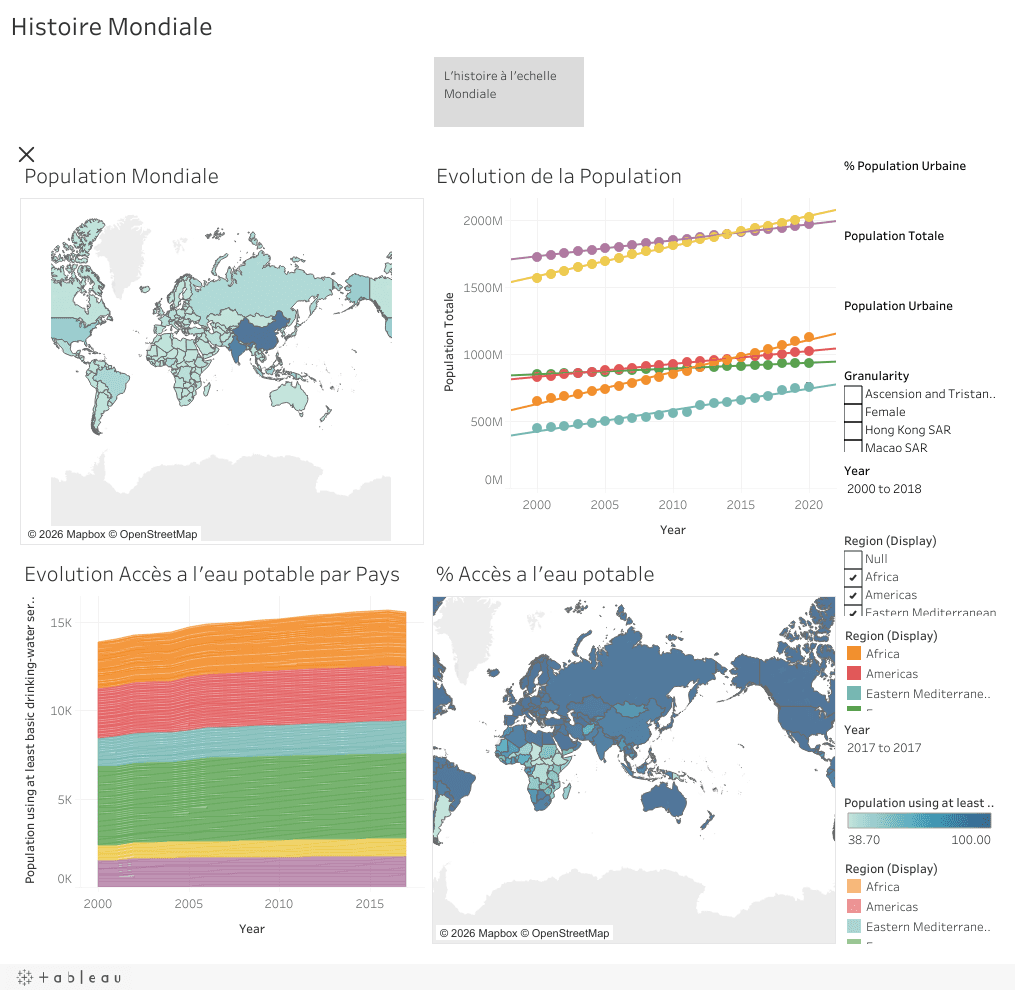
A data analysis and a set of Tableau dashboards helping the NGO DWFA identify the countries where access to drinking water is most urgent, from global down to country level.
Power BI demonstrator for daily warehouse management: productivity, quality, lead times and backlog.
Template method for ABC/XYZ SKU analysis to redesign the layout of a picking area.
Knowledge Center
How Tableau dashboards and data storytelling helped the NGO DWFA identify where and how to act first — and why the same method applies to Supply Chain.
Read article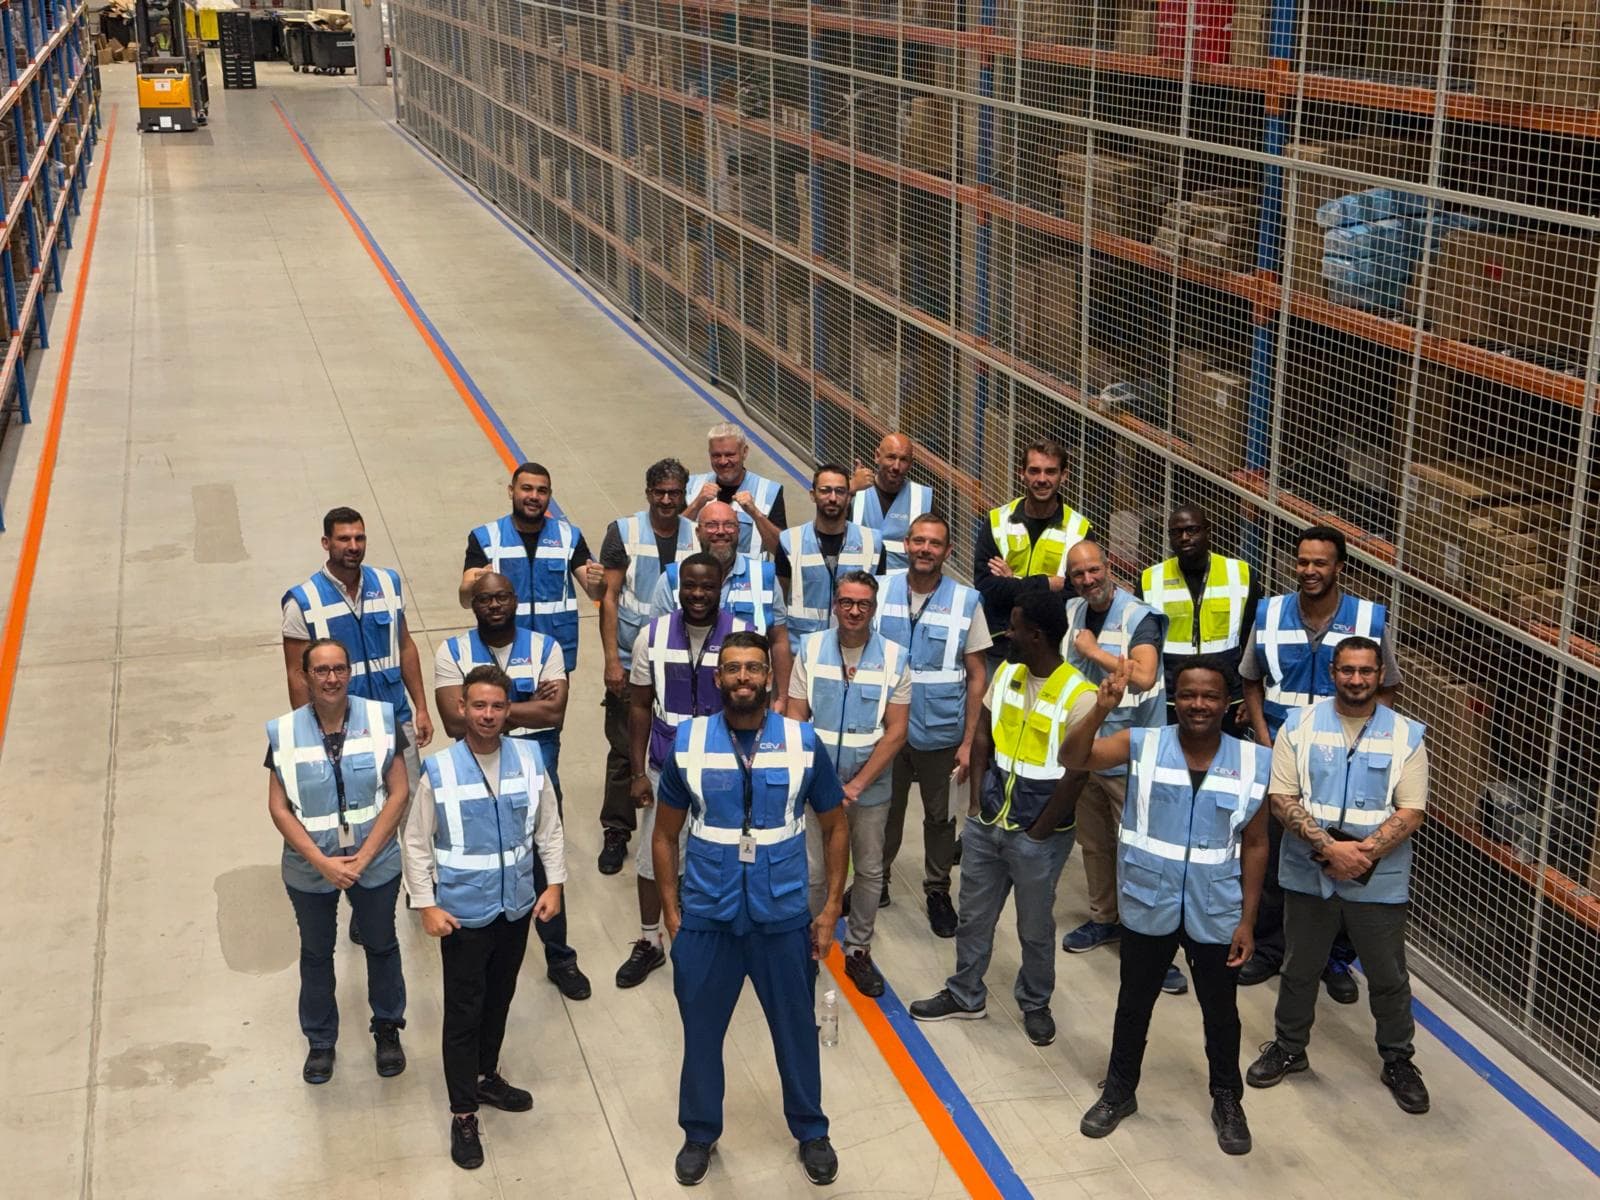
Looking back on an immersion at the heart of European logistics: exchanges, new operational practices and a great human adventure with an international team.
Read articleInstead of looking for where to put AI, start with repetitive, documented, low-risk tasks.
Read articleLooking to optimise your operations, leverage your data or accelerate your digital transformation? Let's talk about your project.