Data Analytics
DemonstrationConcept
Warehouse KPI dashboard
Power BI demonstrator for daily warehouse management: productivity, quality, lead times and backlog.
- Power BI
- SQL
- DAX
Data Analytics
A data analysis and a set of Tableau dashboards helping the NGO DWFA identify the countries where access to drinking water is most urgent, from global down to country level.
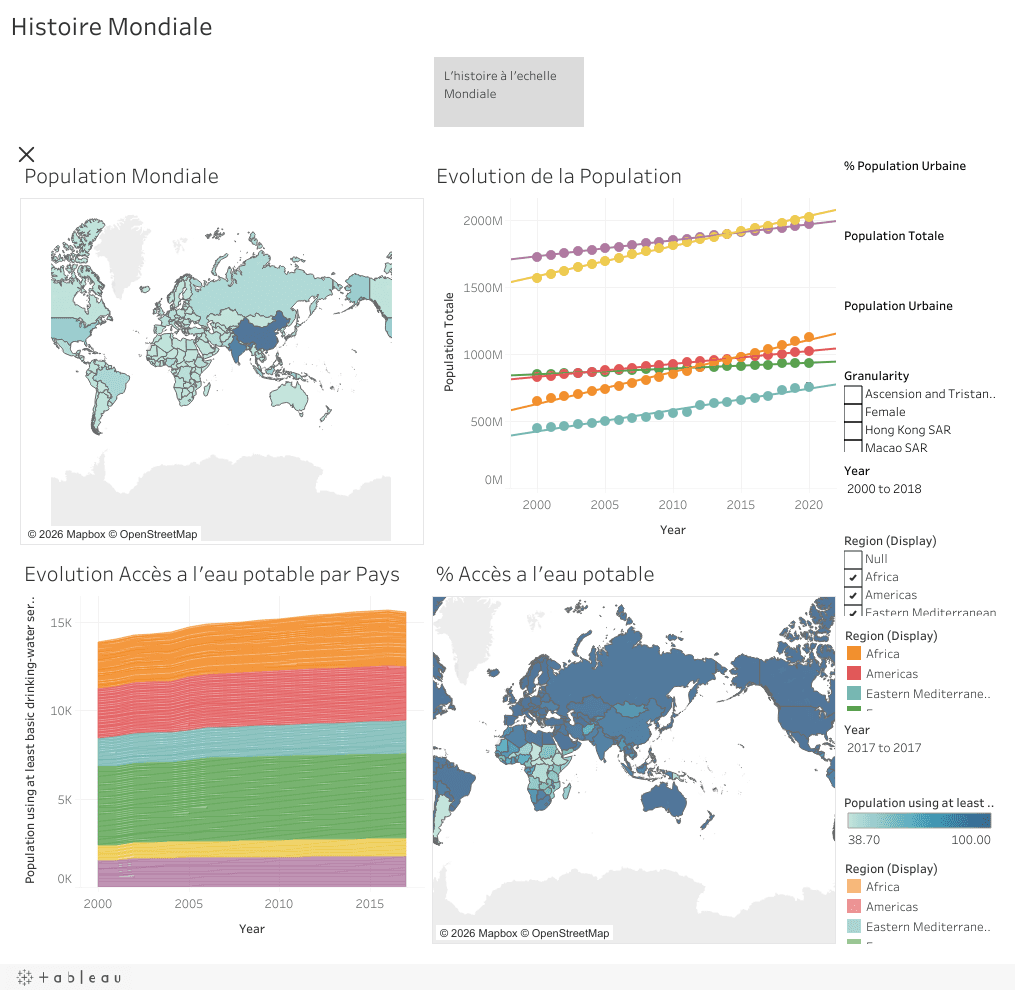
Project carried out during my Data Analyst programme (OpenClassrooms) for the NGO DWFA, whose mission is to improve access to drinking water. The NGO needed a decision-support tool to direct its future field actions.
In which countries should the NGO act first, and how? Several dimensions had to be combined — demographics, urbanisation, level of water access, mortality linked to unsafe water and political stability — to separate the countries where water services must be created, those where they must be modernised, and those where advisory support is most relevant.
Power BI demonstrator for daily warehouse management: productivity, quality, lead times and backlog.
Template method for ABC/XYZ SKU analysis to redesign the layout of a picking area.
Concept of an AI agent answering team questions from internal procedures and activity data.