Skip to content
OPOplitudeOUATTARA Zana

Data Analytics

Warehouse KPI dashboard

Power BI demonstrator for daily warehouse management: productivity, quality, lead times and backlog.

DemonstrationConcept

Demonstration

Demonstration project: a fictional case study illustrating a typical approach. It is not a delivered client engagement.

Context

Fictional case study: a fictional multi-client warehouse whose reporting is produced manually every morning from exports.

Problem statement

How can team leaders get a reliable, up-to-date view of performance without manual re-entry?

Approach

KPI dictionary definition, star-schema modelling of activity data generated for the exercise, SQL preparation queries, then Power BI pages designed per decision level (operations, supervisors, management).

Results

Results not documented at this stage.

Projects and case studies

Data Analytics
Completed
Jan 2022 — Apr 2022

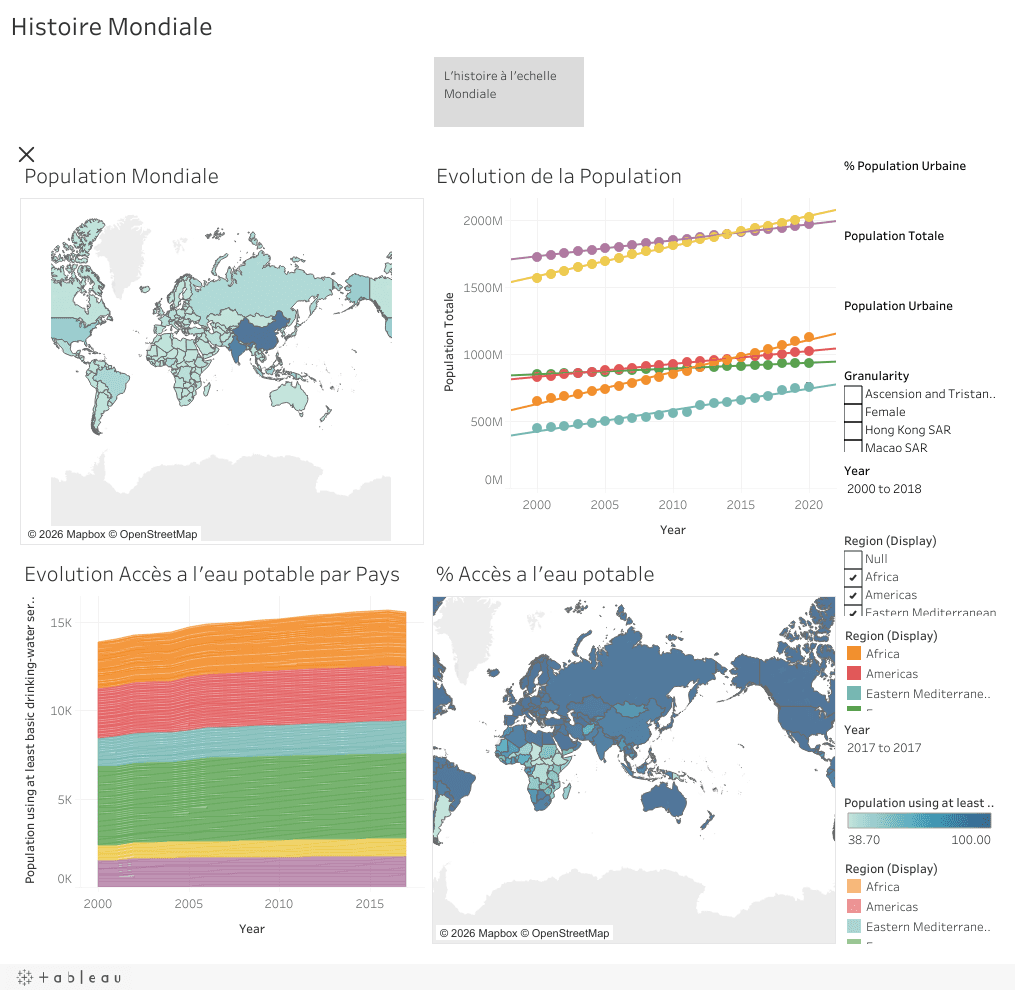
Drinking water access study — NGO DWFA

A data analysis and a set of Tableau dashboards helping the NGO DWFA identify the countries where access to drinking water is most urgent, from global down to country level.

  • Tableau
  • Data storytelling
  • Data visualisation
Supply Chain
DemonstrationConcept

ABC analysis and re-slotting

Template method for ABC/XYZ SKU analysis to redesign the layout of a picking area.

  • Python
  • Pandas
  • Excel
Innovation
DemonstrationConcept

AI assistant for logistics teams

Concept of an AI agent answering team questions from internal procedures and activity data.

  • LLM
  • RAG
  • Python